All posts by tomhouslay

New paper: Testing the stability of behavioural coping style across stress contexts in the Trinidadian guppy

My first empirical work from my postdoc with Alastair Wilson is out now in Functional Ecology (open access). We take a pretty deep dive into analysing individual variation in behavioural plasticity, including comparing multivariate among-individual behaviour across contexts, testing for a single underlying axis of variation, etc. The supplementary information also includes some R code showing how we did the main analyses, and the dataset is available on Dryad.

This paper also got a lot of traction in the popular press due to us showing that guppy ‘personality’ (i.e., consistent individual differences in behaviour) exists, is more complex than might have been thought, and persists across different stressors (which had large effects on the average behaviour in the population). Some of the articles are linked in my Media & Outreach page, and the video of my interview on BBC World News is embedded below.


Advertisement

New paper: ‘Avoiding the misuse of BLUP in behavioural ecology’

I have a new paper (with Alastair Wilson) out in the Behavioural Ecology journal, entitled ‘Avoiding the misuse of BLUP in behavioural ecology‘. Our paper is aimed at researchers working on individual variation in behaviour (e.g., personality, behavioural plasticity, behavioural syndromes), particularly those wishing to investigate associations between that behavioural variation and some other trait or variable (e.g., another behaviour, a physiological response, or even some external environmental variable). The thrust of the paper is really a call to ensure that we are using the proper statistical tools to test our hypotheses, rather than using other approaches that are known to give spurious results. The paper is quite brief, and can be found here (or drop me an email if you require a reprint).

Of course, pointing out problems is in itself not hugely useful without solutions being to hand, and so we have provided these in the form of tutorials for multivariate models in the programming language R. We are still working up more tutorials to cover more of the kinds of issues in which people are interested, so do keep checking back for updates – and let me know if there are any other relevant topics that you’d like to see covered! As has been pointed out on twitter, while we focused on animal behaviour because we work in that field, these models are applicable to many other fields in which researchers are interested in the causes and consequences of variation in labile traits.

NOTE

It has been pointed out to me (post-publication) that the Adriaenssens et al. (2016) paper in Physiology & Behavior, ‘Telomere length covaries with personality in a wild brown trout‘, did not use BLUPs extracted from mixed models in a secondary analysis, and is therefore incorrectly included in Table 1 of our Behavioural Ecology paper. I have apologised to Bart for my error, and contacted the publishers to see whether this reference can be removed from the paper.

New paper: Food supply – not ‘live fast, die young’ mentality – makes male crickets chirpy

I have a new paper out in the journal Functional Ecology, entitled ‘Mating opportunities and energetic constraints drive variation in age-dependent sexual signalling‘. This is work from my PhD with Luc Bussière at Stirling, along with collaborators from the University of Exeter’s Cornwall campus (where I’m currently based).

We used dietary manipulations as well as manipulation of potential mate availability to investigate how male sexual signalling changes with current budget and previous expenditure. We found some cool results about what causes variation in age-dependent sexual signalling – these have implications for ‘honesty’ in sexual displays, and are also a nice reminder that there are simpler explanations than we (as humans, who love seeing patterns in the noise) often cling to.

Our paper also includes a nice example of using ‘zero-altered’ statistical models, enabling us to partition out effects on why males call from the effects on how long they call.

You can find the paper here, or email me for a PDF if you don’t have access to the journal.

Alternatively, the press office at Exeter put together a nice press release, which I’ve pasted below:


Shedding a few pounds might be a good strategy in the human dating game, but for crickets the opposite is true.

Well-fed male crickets make more noise and mate with more females than their hungry counterparts, according to research by the universities of Exeter and Stirling.

It has long been believed that males who acquire ample food can adopt a “live fast, die young” strategy – burning energy by calling to attract females as soon as they are able, at the expense of longevity – while rivals with poorer resource budgets take a “slow and steady” approach, enabling them to save resources and take advantage of their savings later in the season.

But the researchers found that increased diet – rather than any strategic decision by the cricket – led the best-provisioned crickets to chirp for longer. This had no noticeable cost to their lifespan.

Meanwhile hungrier males not only signalled less – meaning fewer female visitors – but also died younger.

Senior author Dr Luc Bussière, of the University of Stirling, said the findings offered a “simpler alternative” to understanding the behaviour of crickets.

“While it was intriguing to think that males might foresee and plan for their future reproductive prospects by strategically staying quiet, what our experiment suggests is actually easier to understand: rather than relying on an ability to forecast the future, crickets appear instead to respond mainly to the resources they have in hand,” he said.

Male crickets signal to females using an energetically expensive call, produced by rubbing together their hardened forewings.

The more time they spend calling, the more mates they attract.

The paper, published in Functional Ecology, studied decorated crickets, which mate about once a day on average during their month-long adult life.

Males need a three-hour recovery period following each mating to build a new sperm package, after which they are able to call again in the hopes of attracting another female.

Researchers found that a male cricket’s decision about whether to call was primarily based on whether females were nearby – rather than how well-fed they were – but the better-nourished males were able to call for longer and thus increase their mating prospects.

The study also provides insights into how energy budgets keep male displays honest for choosy females over the course of the mating season.

“In nature, a ‘better quality’ male will likely have better access to resources,” said lead author Dr Tom Houslay, a Postdoctoral Research Associate at the University of Exeter.

“Low-quality males might be able to ‘cheat’ by calling a lot one day, making females think they are high-quality, but this is not sustainable – so there is ‘honesty on average’.

“A female may be fooled once or twice, but over time males with more energy will call more – meaning females should tend to make the ‘correct’ decision by preferring those males.”

ISBE Plasticity Tutorial

Skip the chat and go straight to the code: ISBE Plasticity Tutorial

I’ve just about recovered from an excellent time at the 16th congress of the International Society for Behavioral Ecology (ISBE), where I saw a ton of cool science, caught up with loads of friends, and learned (and drank, and ate) a lot! I also gave my first talk on the work I’ve been doing in my postdoc with Alastair Wilson – hopefully I can figure out how to share my slides on here at some point – which seemed to go over reasonably well.

At the end of the conference there were various symposia, and I went to one on ‘The Causes and Consequences of Behavioural Plasticity‘ (organised by Suzanne Alonzo and Nick Royle). I had some code I’d made for a previous workshop in our department, so gave a quick tutorial on how to model plasticity (in particular, among-individual differences in plasticity) in R. Unfortunately the licence servers for ASreml had gone down until an hour before lunch, so I didn’t end up showing the multivariate modelling (also turns out I’d forgotten how hard it is to present something in any kind of charismatic fashion when you are scrolling through code and haven’t really had any sleep)… but I have gathered together the code for modelling individual differences in plasticity in both a ‘reaction norm’ (random regression) and ‘character state’ (multivariate modelling) framework at the link:

-> -> ISBE Plasticity Tutorial <- <-

Any comments / suggestions very welcome – just fire me an email, or contact me on twitter! I’m currently working on the manuscript for the work I showed at ISBE, which involved using multivariate models, matrix comparisons etc to figure out the plasticity of personality structure over different contexts – the code (and data) will be made available when the paper is out…

A quick, very unsubtle plug: bookings are now being taken for the next Advancing in R workshop run by PR Statistics (taught by Luc Bussière, with me as glamorous assistant), where we cover data wrangling, visualisation, and regression models from simple linear regression up to random regression. We will also teach the ‘ADF method’ for your statistical modelling workflow – hopefully also to be immortalised in a paper at some point!

Update 1

I have been reminded to stress a very important point…


Update 2

One of the comments I received on this was from Luis Apiolaza, he of quantitative genetics, forestry, and many excellent ASreml-r blog posts. He noted that – had he been writing such a tutorial – he would typically have started from the multivariate approach, and extended to random regression from there (citing a recent study in which they had 80+ sites/traits). I think this is a good point to make, in particular the realisation that it’s very easy to just think about our own studies (as I was doing).

My work is usually in the laboratory, so I’m likely to have a small number of traits / controlled environments that I’ve observed. In these cases, while reaction norms are easy to draw and to think about, modelling the data as character states actually provides me with more useful information. I am also aware that – in ecology and evolution – random regression models have been pushed quite hard, to the extent that it’s seen almost as a ‘one size fits all’ solution, and people are often unaware of the relative advantages of character state models. However, they are not always suitable for the data: it may be that there are too many traits/environments to estimate all the variances and covariances, or – as in another study I’m involved with – the repeated measurements of an individual are taken on an environmental gradient, but it is not possible to control the exact points on that gradient. In that case, of course, we can use random regression to estimate differences in plasticity using all of our data, and convert the intercept-slope covariance matrix to character state for specific values of our environmental predictor if we want to look at relative variation.

I’m not convinced there’s truly a ‘right answer’, rather that it’s nice to have the option of both types of models, and to know the relative advantages / disadvantages of each…

‘Beyond bar and line graphs’

I came across an interesting paper earlier on data visualisation – published last year in Plos One, Weissgerber et al set out reasons why bar or line graphs can be misleading when presenting continuous data. It’s well worth a read:

Weissgerber TL, Milic NM, Winham SJ, Garovic VD (2015) Beyond Bar and Line Graphs: Time for a New Data Presentation Paradigm. PLoS Biol 13(4):e1002128. doi: 10.1371/journal.pbio.1002128

The authors also provide some Excel templates in the supplementary information for creating figures that are more useful than bar or line graphs, including scatterplots, paired plots, etc. I have taken their data and created those plots in ggplot2 (using some dplyr and knitr magic to make the data usable), and published that code over at RStudio’s excellent ‘Rpubs’ resource. Check it out here:

http://rpubs.com/tomhouslay/beyond-bar-line-graphs


Applying the story circle to academic writing

Storytelling comes naturally to humans, but since we live in an unnatural world, we sometimes need a little help doing what we’d naturally do.

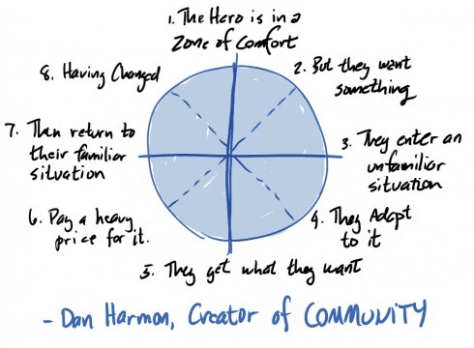
I’m a big fan of the work of Dan Harmon, writer of amazing tv shows like Community and Rick & Morty, and I’ve often heard him talk on his podcast (‘Harmontown’) about his ‘story circle’: a pattern to which most good stories conform.

The REAL structure of any good story is simply circular – a descent into the unknown and eventual return – and that any specific descriptions of that process are specific to you and your story.

The structure itself is pretty simple: a circle, divided and numbered as below, with each number representing a step on our journey.
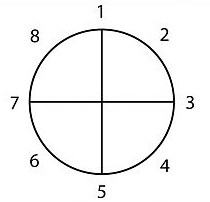
Screen Shot 2016-02-05 at 13.08.31

  1. When you
  2. have a need,
  3. you go somewhere,
  4. search for it,
  5. find it,
  6. take it,
  7. then return
  8. and change things.


It got me thinking about whether research papers fit this kind of pattern, whether they should, and also whether thinking about such a pattern when developing our papers would help structure them better.

“But my paper is about SERIOUS RESEARCH,” you might say. That may be so, but don’t you want your readers to also enjoy reading about it? If your paper isn’t compelling, then will it even leave a lasting impression?

I’ve taken most of this from Harmon’s notes on the Channel 101 page on story structure, and it’s worth going through that to see some more examples of how some of our favourite movies (ok, he mostly focuses on Die Hard) fit the pattern.

Screen Shot 2016-02-05 at 13.02.05

Let’s go through the steps, and see how this structure might relate to the typical academic paper.

1. Establish a protagonist

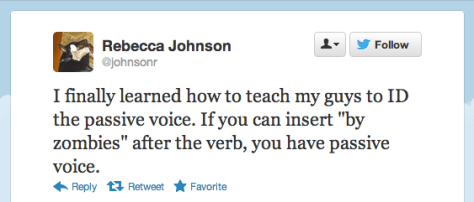
Who is the protagonist in a research paper? This is – on the face of it – a tricky question, particularly as we are often taught to write in a weird passive (third-person?) voice, resulting in bizarrely disjointed sentences. The crusade against such an impersonal style includes things like the ‘by zombies’ meme, but still some people push it for reasons like ‘the focus should be on the results’, or ‘science should be impartial’. I agree, in that your research should not be carried out with an agenda. But you came up with the question, you designed the experiment, you carried it out, and you are presenting and interpreting the results. You are taking the reader on a journey with you. Don’t write yourself out of it.

Screen shot 2012-10-24 at 4.17.24 PM

In fact, the context of a research paper means your reader instinctively knows who the protagonist is: a scientist, pluckily trying to advance their field. You don’t need to flesh it out any more than that. But you do have to establish the ‘zone of comfort’: the current state of research in your field. By bringing others into your zone at the beginning of the story, this is how your reader identifies with you.

2. Something ain’t quite right

Things aren’t perfect. They could be better.

Science in a nutshell. We could always understand things better than we currently do. Your job here is to show the reader what’s missing, what the gap in your knowledge is. This is your call to adventure.

3. Crossing the threshold

You are now entering an unfamiliar situation, because that’s what science is about: driving into uncharted territory, in search of something more. Harmon says here to figure out what your ‘movie poster’ is; that maybe doesn’t work as an analogy for scientists, as we have a tendency to front-load presentations of our research with the results. The threshold we are crossing here is between defining our knowledge gap, and attempting to rectify that gap with further research. Our movie poster is not the results, but the question.

4. The road of trials

Is there a more fitting descriptor for a methods section? Harmon talks here of how, in ‘Hero with a Thousand Faces’, Joseph Campbell “evokes the image of a digestive tract, breaking the hero down, divesting him of neuroses, stripping him of fear and desire”. You’ve crossed the threshold, the adventure has begun; “our protagonist has been thrown into the water and now it’s sink or swim”.

Your reader needs to know the tools with which you are going to approach your call to adventure, and they need to know this as quickly and efficiently as possible.

The purpose here has become refreshingly – and frighteningly – simple.

5. Meeting with the goddess

This is a time for major revelations, and total vulnerability

…In other words, the results of your research. What did you find? Don’t be afraid to say, we found nothing – particularly if your trials were designed well enough that you can say that conclusively.

To paraphrase Harmon’s words here: we started from a position of safety and comfort (1), but a lack of completion (2) drew us to a question (3) and we were pulled across a threshold into the unknown. Via our experiment, our understanding was transformed (4) by gaining this new, hitherto-unknown knowledge (5). Show it with a definable moment, advises Harmon. Clear, understandable figures and tables bring the reader with you in these revelations.

On the circle, this is the opposite of the protagonist’s zone of comfort; movement beyond this point requires you to push forward. Figuring out the question, and performing the experiment, was almost the easy part compared to what comes next…
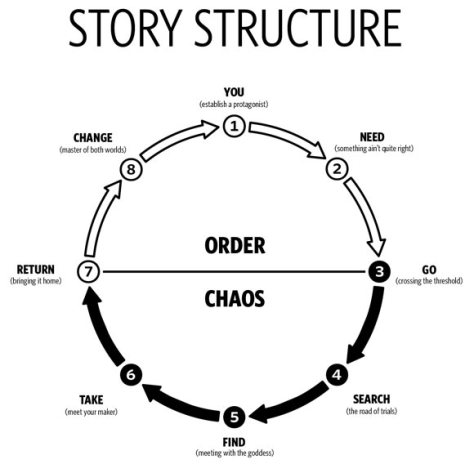
storystructure.jpg

6. Meet your maker

This half of the circle has its own road of trials – the road back up. The one down prepares you for the bed of the goddess and the one up prepares you to rejoin the ordinary world.

I like the description Harmon gives in a later page:

The hardest part (both for the characters and for anyone trying to describe it). On one hand, the price of the journey. The shark eats the boat. Jesus is crucified. The nice old man has a stroke. On the other hand, a goal achieved that we never even knew we had. The shark now has an oxygen tank in his mouth. Jesus is dead- oh, I get it, flesh doesn’t matter. The nice old man had a stroke, but before he died, he wanted you to take this belt buckle. Now go win that rodeo.

With the results in hand, you now have to do the hardest part: interpret what they mean. The ‘heavy price’ we pay as scientists is that sometimes we don’t find what we expect, and things are often messy, and complicated, and hard, and we have to think about them a lot. Again, look at the opposite side of the circle, which was the call to adventure (2). You identified a knowledge gap, and now you need to consider what your results mean in that context – and bring your readers with you.

Now, instead of reacting to the forces of the current state of research – “adapting, changing, seeking” – you have BECOME the current state of research. You are the cutting edge.

You have become that which makes things happen. You have become a living God.

(So I guess this is about where you start fantasising about submitting to Nature)

7. Bringing it home

It’s not a journey if you never come back.

The return to the familiar situation – we can now come back to the beginning of the story, the state of research as we left it, armed with the new knowledge gleaned on our journey.

8. Master of both worlds

The protagonist, on whatever scale, is now a world-altering ninja. They have been to the strange place, they have adapted to it, they have discovered true power and now they are back where they started, forever changed and forever capable of creating change. In a love story, they are able to love. In a Kung Fu story, they’re able to Kung all of the Fu. In a slasher film, they can now slash the slasher.

…And in a science paper, you can now science the science. How are you capable of all this? Because of what happened before – just look at the opposite side of the circle. The opposite of (8) is (4), the road of trials. You did a science, and now you can science some more. Show your reader what you’ve done. The state of research in your field is forever changed, because of your journey. A hero’s journey.


To finish, Harmon provides an example of breaking down the structure using The Matrix: the story of an everyday guy (1) that gets a weird call (2) and, upon following it, realizes that reality was an illusion (3). He learns the ropes (4), talks to the oracle (5), loses his mentor (6), goes back (7) and saves the fucking day (8). Can we apply this kind of structure to our favourite science papers?

Andersson (1982) Nature

Malte Andersson believed Darwin’s hypothesis about the evolution of male sexual ornaments through female preferences was plausible (1), but saw little experimental evidence that such preferences exist (2). Would experimental increase of ornaments confer higher mating success (3)? He manipulated widowbird tail length (4), found males with elongated tails won more mates than those with shortened or ‘control’ tails (5), and excluded other variables to conclude that changes in tail length caused the differences in attraction (6). His results supported Darwin’s hypothesis that certain male ornaments are favoured by female mate choice (7), and probably evolved through it (8).

Not as snappy as the Matrix, sure – but Andersson’s journey changed the idea of sexual selection as ‘plausible with no great evidence’ to ‘plausible with some solid evidence’. A basis for further journeys. For more heroes to come.

Will knowing this structure make you a great writer? No. To return to a quote from earlier:

The REAL structure of any good story is simply circular – a descent into the unknown and eventual return – and that any specific descriptions of that process are specific to you and your story.

You still need a story to tell. But this might just help you figure out how to tell it.


——————-

Quotes all taken from Harmon’s ‘Story Structure‘ posts on the Channel 101 wiki.

——————-

Update: Through the delights of twitter, I just found that Ian Lunt has a video online of a talk he gave on using this approach for science communication, called ‘Shaping stories to save the world‘. I highly recommend watching this, particularly as Ian discusses the difference between the circle and the ‘hourglass’ approach to telling a story. It comes to mind that the story circle may be better suited to seminars and popular writing than it is to research papers – something to think more about, anyway…

Of carts and horses

I have been working on a post for some time now, in which I was planning to use web-scraping in R to gather sports-related data from webpages and then run some fancy analysis on it. But when I say ‘working on’, I mean that I’ve playing around with the data, staring at a whole bunch of exploratory plots, and trying to come up with an angle for the analysis.

And, so far, I’ve come up with: nothing.

But perhaps some good can come out of this. The process of trying to come up with an idea to fit the data reminded me of this quote by Sir Ronald Fisher (I should admit that I know of the quote because a guy on the R mixed models mailing list has it in his signature):

To call in the statistician after the experiment is done may be no more than asking him to perform a post-mortem examination: he may be able to say what the experiment died of.

In the past couple of years, I’ve started teaching week-long statistics workshops (*cough*), which are incredibly satisfying (if also incredibly draining!). I have also gone through that enlightening period where learning a little more makes you realise how much you don’t know, which opened up a whole slew of new things to learn (also, I have started listening to statistics-related podcasts, which possibly means that I need professional help). I’m lucky in that I’ve managed to figure out some of this stuff, which leads to other people now coming to me for help with their analysis. Questions range from ‘does my model look ok?’ all the way to ‘I have this data, how should I analyse it?’. The latter always brings that quote into sharper focus.

It’s for this reason, the idea that statistical analysis should be an intrinsic part of the planning of any project, that I was interested to read articles recently on the idea of registering studies with journals prior to gathering the data. This idea stems mainly from the fact that too much of whether something gets published depends on it being a positive result, and the ‘spin’ of the results – with hypotheses often dreamed up post-hoc – affects which journal the study gets published in (obviously there’s more nuance than that, but maybe not that much more). By registering the design beforehand, you can go to a journal and say: this is the question, here are our hypotheses, here’s how we’re going to tackle it with an experiment, and here’s how we will analyse the data. The journal would then decide beforehand if they think that’s worth publishing – whatever the result.

This is a little simplistic, of course – there would have to be the usual review process, and there would obviously be leeway for further analysis of interesting trends on a post-hoc basis – but it would enforce greater thinking about an analysis strategy prior to embarking on a study. Even the simple task of drawing out the potential figures that would come out of the data collection is crucial to the process, as they help to clarify what is actually being tested.

So – that post I was originally setting out to write? I have the data, but I still haven’t had any good ideas for how to use it. And maybe it’s that kind of backwards approach that we all need to stay away from.

Further reading:

Nature: ‘Registered clinical trials make positive findings vanish

Kaplan & Irvin (2015) Plos One: ‘Likelihood of Null Effects of Large NHLBI Clinical Trials Has Increased over Time

The Guardian: ‘Trust in science would be improved by study pre-registration

The Washington Post: ‘How to make scientific research more trustworthy

New York Times: ‘To get more out of science, show the rejected research

FiveThirtyEight: ‘Science isn’t broken‘ (This is a must-read)

My favourite statistics podcasts!

Not so standard deviations

FiveThirtyEight’s ‘What’s the point?’

Interview on the Career 100 podcast

I was interviewed recently for an episode of the Career 100 podcast, part of the College Funding Resource. The podcast is aimed at people trying to decide on a college course, and introduces them to various different careers. I was given the task of covering ‘biologist’, which – as you are probably aware – is a bit of a catch-all term that is difficult to negotiate in a half-hour interview! Hopefully I managed to make clear the breadth of different careers within the domain of biology, while making it clear I can only really advocate for the evolutionary sphere (and I feel like I’m only occupying a very tiny niche within that anyway!).

Anyway – it was a very fun interview to do, and if you want to hear me rambling at greater length than I get to do on Breaking Bio (although let’s face it, that is definitely for the best), you can find it here.

Plus I even got my own fancy little podcast cover art!


My real science (Day 1)

In my last post, I gave a quick overview of my week curating the @realscientists twitter feed, but focused – unsurprisingly – on the delights of the ‘humpoff’ and its ensuring press coverage! As a new scientist takes the reins of that account each week, condemning the previous tweets to the depths of the internet, I thought I would collect my science-based tweets into a post here. Mainly to show how my week was basically an exercise in drawing diagonal lines. I’ll begin here with my tweets from the first day of my week in charge, lightly edited to add a mild bit of coherence:

Let’s start with a little background… obviously, no week on evolution would be complete without some Darwin quotes (taken from ‘Darwin and Genetics‘, an open-access paper by Brian Charlesworth & Deborah Charlesworth):

“The power of Selection, whether exercised by man or brought into play under nature through the struggle for existence and the consequent survival of the fittest, absolutely depends on the variability of organic beings. Without variability, nothing can be effected; slight individual differences, however, suffice for the work, and are probably the chief or sole means in the production of new species.” (DARWIN, 1868)

CHARLES Darwin was the first person to appreciate clearly that evolution depends on the existence of heritable variability within a species to generate the differences between ancestral and descendant populations. The development of Darwin’s thoughts on the nature and causes of evolution is clearly documented in his “transmutation” notebooks of 1836–1838 (BARRETT et al. 1987). Once he had decided that species originated by “descent with modification,” Darwin quickly realized the need to find a mechanism for accomplishing the changes involved. In formulating the idea of natural selection, he was greatly influenced by the experience of breeders in artificially selecting populations of domestic animals and plants. Chapter 1 of The Origin of Species (DARWIN 1859) is famously devoted to documenting the existence of variability in these populations and the effectiveness of artificial selection:

The key is man’s power of cumulative selection: nature gives successive variations; man adds them up in certain directions useful to himself” (DARWIN 1859, p. 30).

It was only a short step to applying this observation to selection in nature:

Can it, then, be thought improbable, seeing that variations useful to man have undoubtedly occurred, that other variations useful in some way to each being in the great and complex battle of life, should sometimes occur in the course of thousands of generations? … This preservation of favourable variations and the rejection of injurious variations, I call Natural Selection (DARWIN 1859, pp. 81–82).

In essence, Darwin identified three conditions that are necessary for evolution via natural selection. First off: a population must exhibit phenotypic variation. ‘Phenotype’ is a fancy word for the set of observable characteristics of an individual. An individual’s phenotype can be anything we measure: body size, shape, development time, lifespan… (And, yes, their behaviour too! But let’s leave that for a little bit later). Have a look at people around you: you (hopefully) all have the same number of fingers and toes, but what about something like, say, height? If you measured the heights of a population (and grouped number of ppl by height), your graph might look like this:

cont_dist

So: within a given population, individuals must be different from each other. What next?

Darwin realised that (ii) these variations must be associated with differences in survival and reproduction. (Hmm… as a very short man, I now regret using ‘height’ as the example trait in my previous tweet… ). Anyway! Individuals must be different from each other, and these differences create variation in how they survive and reproduce…

(iii) Variation in traits must be heritable: parents and offspring must resemble each other in these traits.

Famously, Darwin was unaware of Mendel’s work, meaning that he did not know what the mechanism of inheritance was. On Wed, I’ll talk a little abt quantitative genetics, which helps us understand the inheritance of traits that vary in a continuous fashion (NOTE: I don’t think I did). For now, let’s consider what contributes to phenotypic variation: obviously genes, but what else?

An individual’s environment can strongly affect its phenotype. Recently, the UK govt has come under fire for considering dropping free school meals – health professionals and academic studies claim that diet quality affects academic performance: environment changes the phenotype! Broadly speaking, that would represent a change in the population mean due to environmental effects: i.e., as diet quality (envt value) increases, so academic performance increases.

trait mean

But we also know that different genotypes vary in trait value:

trait mean2

…and genotypes can differ in how they respond to environmental change: known as genotype-by-environment interactions:

trait mean3

So: heritable phenotypic variation is needed for evolution by natural selection, and phenotypic variation can be affected by G, E, GxE! Excitingly, environmental effects can also change the extent of the variation available for selection to act on:

trait mean4

These lines represent what we call ‘reaction norms’: a reaction norm is a function that describes the change in a genotype’s phenotype over a range of environments. The ability of a genotype to express different phenotypes as environmental conditions change is known as ‘phenotypic plasticity’. Plasticity enables an organism to ‘fit’ its phenotype to the changing environment. Let’s look at a couple of examples…

The desert locust Schistocerca gregaria has a solitary form, in which individuals are well camouflaged and avoid others. However, in their gregarious form they are more active, brightly coloured and form vast migrating swarms.

locust1

This change is elicited by repeated physical contact, e.g. through touching or jostling, producing the plastic response. Rogers et al tickled locust legs repeatedly w/ paintbrushes, causing full behavioural ‘gregarisation’ within hours!

Screen Shot 2015-10-11 at 21.51.07Screen Shot 2015-10-11 at 21.51.22

You can watch a rather melodramatic video about this experiment:

youtube.com/watch?v=uURqcI

It’s since been found that the mechanism is serotonin-related – read more about this here.

locust2

This is cool, but I’m more interested in plasticity in ‘labile’ traits: those that are expressed repeatedly across an individual’s lifetime. For example: song! Plenty of animals sing to mark out territories or attract mates, and this is a trait that is expressed repeatedly. There has been a lot of interest in how animals can respond / have responded to the increase in background noise caused by human activity (@c_n_anderson then sent me two reviews on this topic: Patricelli & Blickley 2006Barber et al 2010). In one experiment, Verzijden et al recorded territorial male chiffchaffs singing along quiet riverbeds and near busy highways. They then raised the background noise at riverbed territories to highway levels, and recorded those birds again… and, finally, recorded the same birds again at normal riverbed background noise (having previously increased it). Here, you can see the plastic response of the riverside birds in minimum song frequency as background is manipulated:

Screen Shot 2015-10-11 at 22.03.12

So, why aren’t all animals all plastic all the time? There are costs and limits to plasticity; one such cost is ‘environmental mismatching’. What if there’s insufficient environmental information, or the wrong environmental information is used? The phenotype is then not the ‘right’ one for the environment. This is a particular problem for ‘developmental plasticity’, where individuals use information about their environment to ‘predict’ the optimal phenotype. There’s a nice paper by on ‘socially cued anticipatory plasticity’: Kasumovic & Brooks 2011. So, that might be bad when the trait is fixed at some point, but what abt individuals that can change the trait in a flexible fashion?

Firstly, let’s keep in mind that assessing the environment and changing trait values is likely to be costly (in time and resources – we’ll talk more later about the importance of resource costs). But also, plasticity itself – the ability to change – may be under selection! Not just the intercept, but the slope of the reaction norm! Plasticity can be adaptive (producing a phenotype in the same direction as the optimal value in the new environment), but can also be maladaptive. Only if the plasticity itself can be shown to have been moulded during evolutionary history to be more effective than a canalised (fixed) phenotype can we consider it to be adaptive. We’ll talk a little more about this tomorrow, but here’s a taster: Earlier, we considered a bird that changes its song frequency depending on background noise. What if only some individuals did that, while others maintained a steady frequency, no matter what the background noise. In some environments, plasticity is undoubtedly better. BUT… what if, in general, this actually gave no survival / reproduction advantage over time? In that case, while the ability to modulate frequency might appear to be adaptive, there’s no evidence that this is the case! MIND. BLOWN.

Oh, and also let’s remember selection acts on ‘extended phenotypes’. Fig from Bailey (2012):

ext_phen

(…but feel free to dust off your copy of excellent book as well!)

This resulted in a brief digression about studying plasticity in extended phenotypes using spider webs, and to social behaviour among spiders:

Michelle LaRue then tweeted me her recent paper, which posited that philopatry in king penguins was life history plasticity – perhaps an important way for animals to deal with climate change. This hints at some reasons as to *why* we are interested in plasticity: it lends to the idea of populations moving to novel environments, or coping with changes in environmental conditions.

And, with the sounding of a CLIMATE CHANGE KLAXON, my first day at @realscientists came to an end!

Outreach: starts with Real Science, ends in a #HumpOff

I am coming to the end of my week-long tenure at @RealScientists – a rotational twitter account that brings a different scientist to its readers every week. This week, I started with the best of intentions – tweeting about genotype-by-environment interactions, phenotypic plasticity, and studying ‘animal personality’…

…but things took a turn when I decided to follow Anne Hilborn‘s previous competitive hashtags and start a #HumpOff!

It soon took hold, with entries flooding in from across the world, and covering all manner of amazing humping-related facts! The ‘competition’ even made it into the media, with coverage from the Washington Post, New York Post, io9’s Gizmodo blog, Slate’s French site, what appears to be a Croatian tabloid, Serbian National Geographic, the French newspaper 20 Minutes, and the Independent! I was interviewed for the NY Post via email, but I had to come back from the pub to write my replies – none of which made it into the article. Let’s say it was because they were delayed, not that I’d had a really strong beer and started rambling a bit…! Anyway, I thought I should post my responses, in case anyone is interested in the purpose* behind the #HumpOff.

*may include post-hoc reasoning

How did the idea for HumpOff come about? Is it recurring or was this the first time?

I really enjoyed the ‘JunkOff’ hashtags that Anne Hilborn started recently, getting scientists (and non-scientists) to post photos of animal genitalia (perhaps I should revisit my use of ‘enjoyed’ there…!). My PhD was in the field of sexual selection and life history: I used crickets to investigate how males invest their energy in trying to attract females across different ages, and how this impacts investment at other ages, in lifespan, etc. The side effect of this is that I’ve spent a not-inconsiderable chunk of my adult life thinking and reading about animal sex! I know there is so much awesome and weird sex stuff out there in the animal kingdom – way beyond just genitalia(!) – and I wanted other people to know about it.

Is there a deeper goal? Like awareness or just for fun? 

It’s been a LOT of fun, and the main idea was just to make people aware of just how much crazy diversity there is in animal mating systems – not just between but also within species! There are weapons that evolved through male competition for mates, ornaments from female preferences, alternative strategies (big males that fight rivals for access to females, while smaller males ‘sneak’ matings behind their backs), sexual conflict – where males and females have conflicting interests, which can create ‘arms races’ in evolving adaptations (e.g. in water striders) – and even sex role reversal! For example, in some dance flies, which are studied by my PhD supervisor and his supervisor before him, the females can have ornaments that make them appear bigger in the mating swarms. These females don’t hunt, but instead rely on ‘nuptial gifts’ of prey, offered to them by males during courtship. Males prefer to mate with females that look big and bursting with eggs, so females with ornaments (that make them look bigger) will get more matings, hence more food – this is how we think the ornaments evolved:

Part of my job as an evolutionary biologist is to think about why there is so much diversity (both within and between species). What are the different pressures that select for adaptations? Why is there so much variation within populations, especially in sexually-selected traits? I want people to be aware of the amazing diversity in the animal world, even in the tiniest, weirdest creatures, and think about why these adaptations and systems have evolved.

Do you have a favorite tweet so far? 

So many favourites! Here are a few:

I broke the dreams of someone who posted a nice picture of mating damselflies that create a heart shape:

Male black widows use ‘mating plugs’ to stop subsequent males from inseminating the same female:

Female haglids eat the fleshy hindwings of males during mating – but that gives the males just enough time to attach their spiny genital sex traps, after which they can push the female off their wings but continue the mating!

I don’t even know what is happening here:

But I do love that Nate Morehouse provided a photo of the butterfly ‘vagina dentata’!

Will a winner be announced since its a “competition”? 

Haha, maybe! The anglerfish got a lot of traction, possibly because of the oatmeal comic, and the antechinus also has a lot of fans – which is fair enough, as it’s a tiny, cute mammal that sexes itself to death. However, I think I’ll use my own biases to pick an insect winner. Invertebrates have to get a win sometime, it may as well be for the #HumpOff!